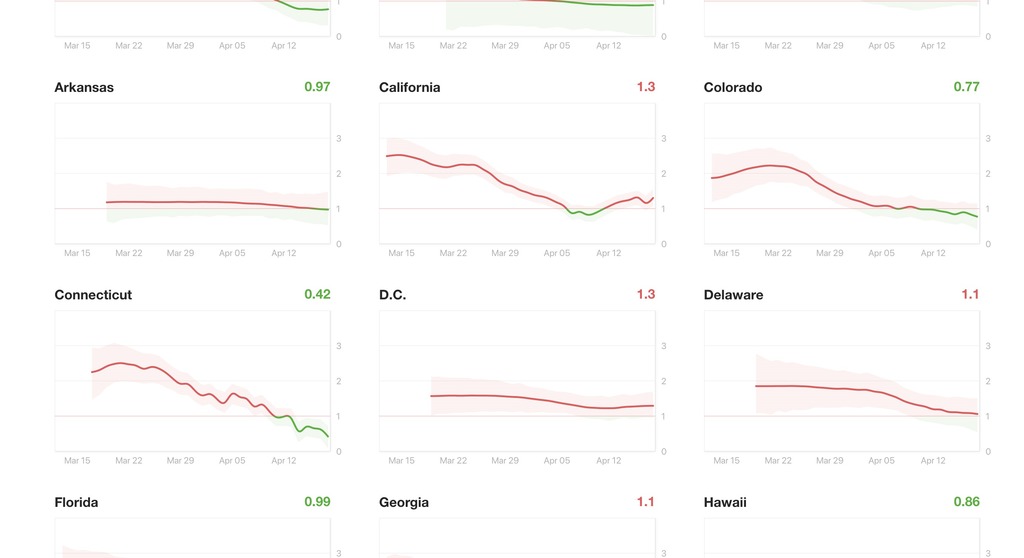
Instagram Co-Founders Kevin Systrom and Mike Krieger have reunited to build a beautiful tool for ordinary people to see how fast the virus is growing. It's called Rt(rt.live). They are focusing on the Rt value, which is the effective reproduction rate of the virus in a particular location.
The Rt value basically determines how many people on average are getting infected by one infectious person. If the number is above 1, it means the rate of growth of the virus in that area is high and community spread is active. If the number is below 1, it means one person is infecting less than one person, which is a great sign indicating that the community measures are working and the growth is slowing down and will come to a stop!
From the tool, we could visualize that some states in US like Connecticut, Colorado, and Alabama are in the green zone and slowing down the transmission. We could also see that some states who we thought had a grip of the situation like Washington and Idaho have come back to red zone from the green zone! South Carolina, Ohio, and North Dakota currently have the worst Rt values of 1.5 or above! Around 70% of the US states are currently in the red with an Rt value of 1 or above!

This is a snapshot from the website where you can see the list of all the states and their Rt values. You can go back up to 3 weeks to visualize the data.